Application Diagnostics
One really useful feature of Zend Server is the code trace feature that can show you the method-by-method execution of any given PHP request. This is especially useful in a Zend Framework 2 application as the use of Events and Service Manager means that our code base isn’t necessarily linear.
Let’s consider a contrived example and introduce a delay into our codebase. One
of the more common causes of slow down is related to database calls taking too
long due to a complicated query, incorrect indexing or by retrieving too much
data. We have a very simple database table with just 5 rows, so we can simulate
this by adding a sleep() call to our TaskMapper’s fetchAll() method.
Open Checklist/src/Checklist/Model/TaskMapper.php and add sleep(5); just
before the end of the fetchAll() method:
Checklist/src/Checklist/Model/TaskMapper.php:
1 2 3 4 5 6 7 8 9 10 11 12 13 14 15 16 | public function fetchAll()
{
$select = $this->sql->select();
$select->order(array('completed ASC', 'created ASC'));
$statement = $this->sql->prepareStatementForSqlObject($select);
$results = $statement->execute();
$entityPrototype = new TaskEntity();
$hydrator = new ClassMethods();
$resultset = new HydratingResultSet($hydrator, $entityPrototype);
$resultset->initialize($results);
sleep(5);
return $resultset;
}
|
It will now take 5 seconds (and a little bit) to display the list of tasks.
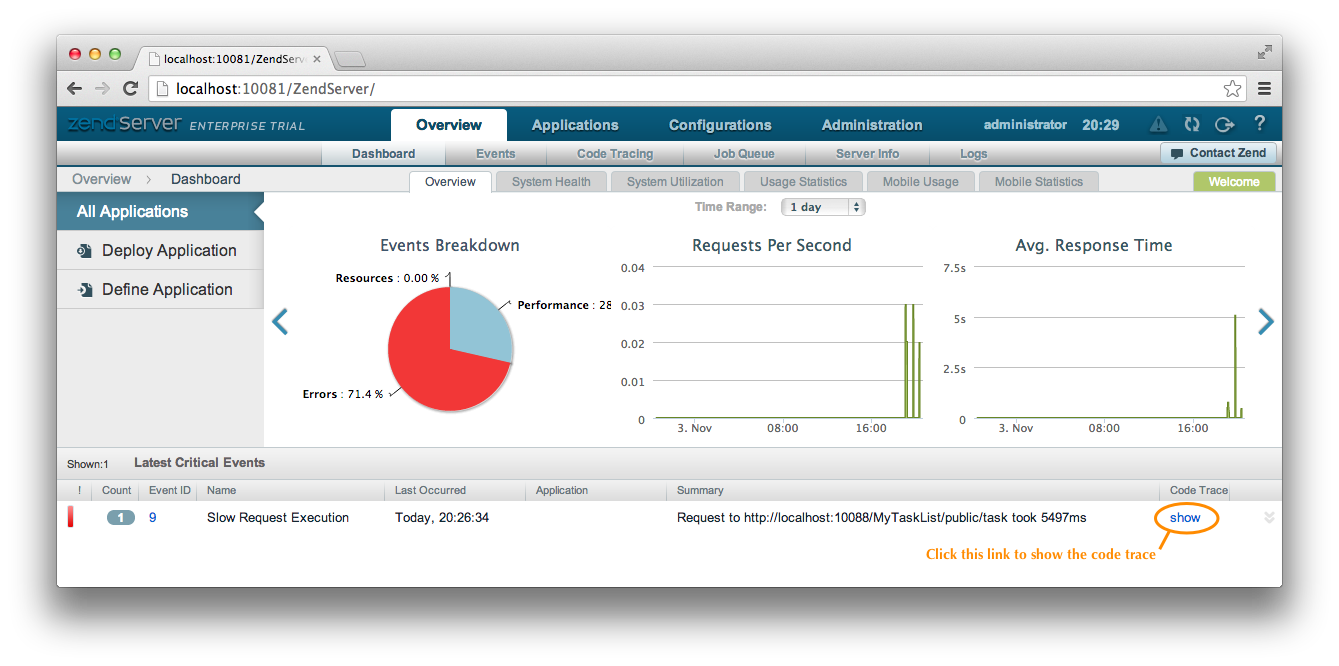
If you now look at the home page of Zend Server’s console, you’ll see a “Slow Request Execution” critical event listed. Click on the “show” link in the “Code Trace” column as shown:
You will then see much more detail about this critical event. The easiest way to use the profile view is to click on the “Statistics per Function” tab and then order by “Just own” total running time.
This will result in the display of the slowest method at the top as shown in the sceenshot.
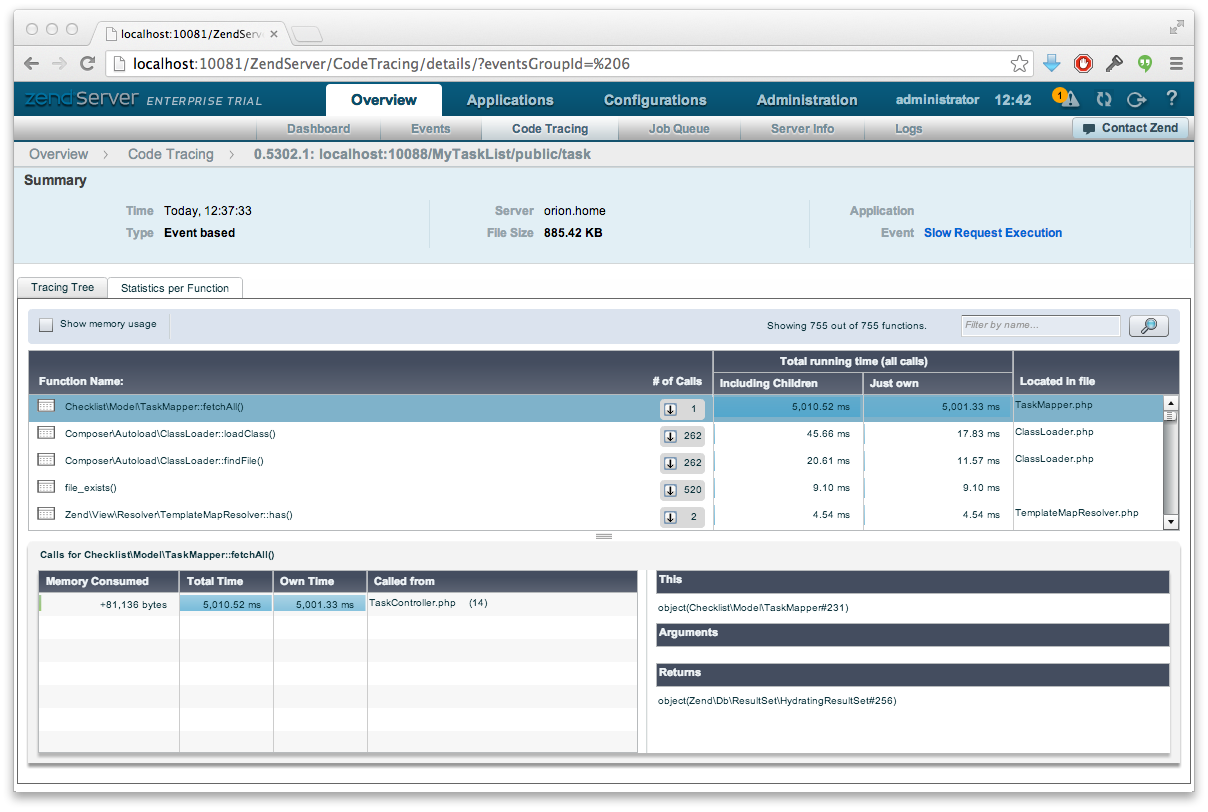
As you can see, Zend Server has correctly determined that fetchAll() is the cause of the slowdown and so we can immediately go to the problem source in Zend Studio and fix the problem.
In addition to helping debugging while developing, this is obviously also extremely powerful when Zend Server is running on the production servers as this profile information is then available for those situations when a given issue only seems to happen on the live web site.
Step-by-step debugging
Another useful feature of Zend Studio and Eclipse/PDT is the step-by-step debugger. With the debugger you can set breakpoints in your code and then run the page in a browser. When the breakpoint is reached, Zend Studio pauses the page and you can then inspect variables and move forward through your code one line at a time.
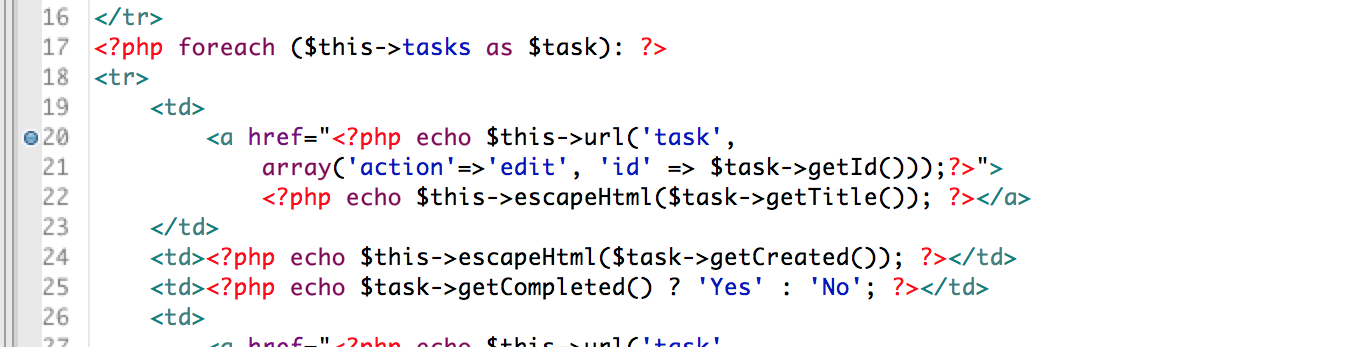
To see this in action, let’s inspect the value of $task in the checklist
module’s index.phtml file. Open the
module/Checklist/view/checklist/task/index.phtml file and double click in the
gutter next to the opening <a tag to set a blue breakpoint marker:
The break point is now set. The easiest way to run to this point is to use the Zend Studio Firefox tool bar. Once installed, you can navigate to http://localhost:10088/MyTaskList/public/task in Firefox and then press the Debug button in the toolbar. Zend Studio will then come to the foreground and ask you if you want to use the Debug perspective. Answer yes, as this view is designed to provide useful information while debugging. Zend Studio will pause the application on the first line of index.php, so press F8 to continue to the breakpoint that you set.
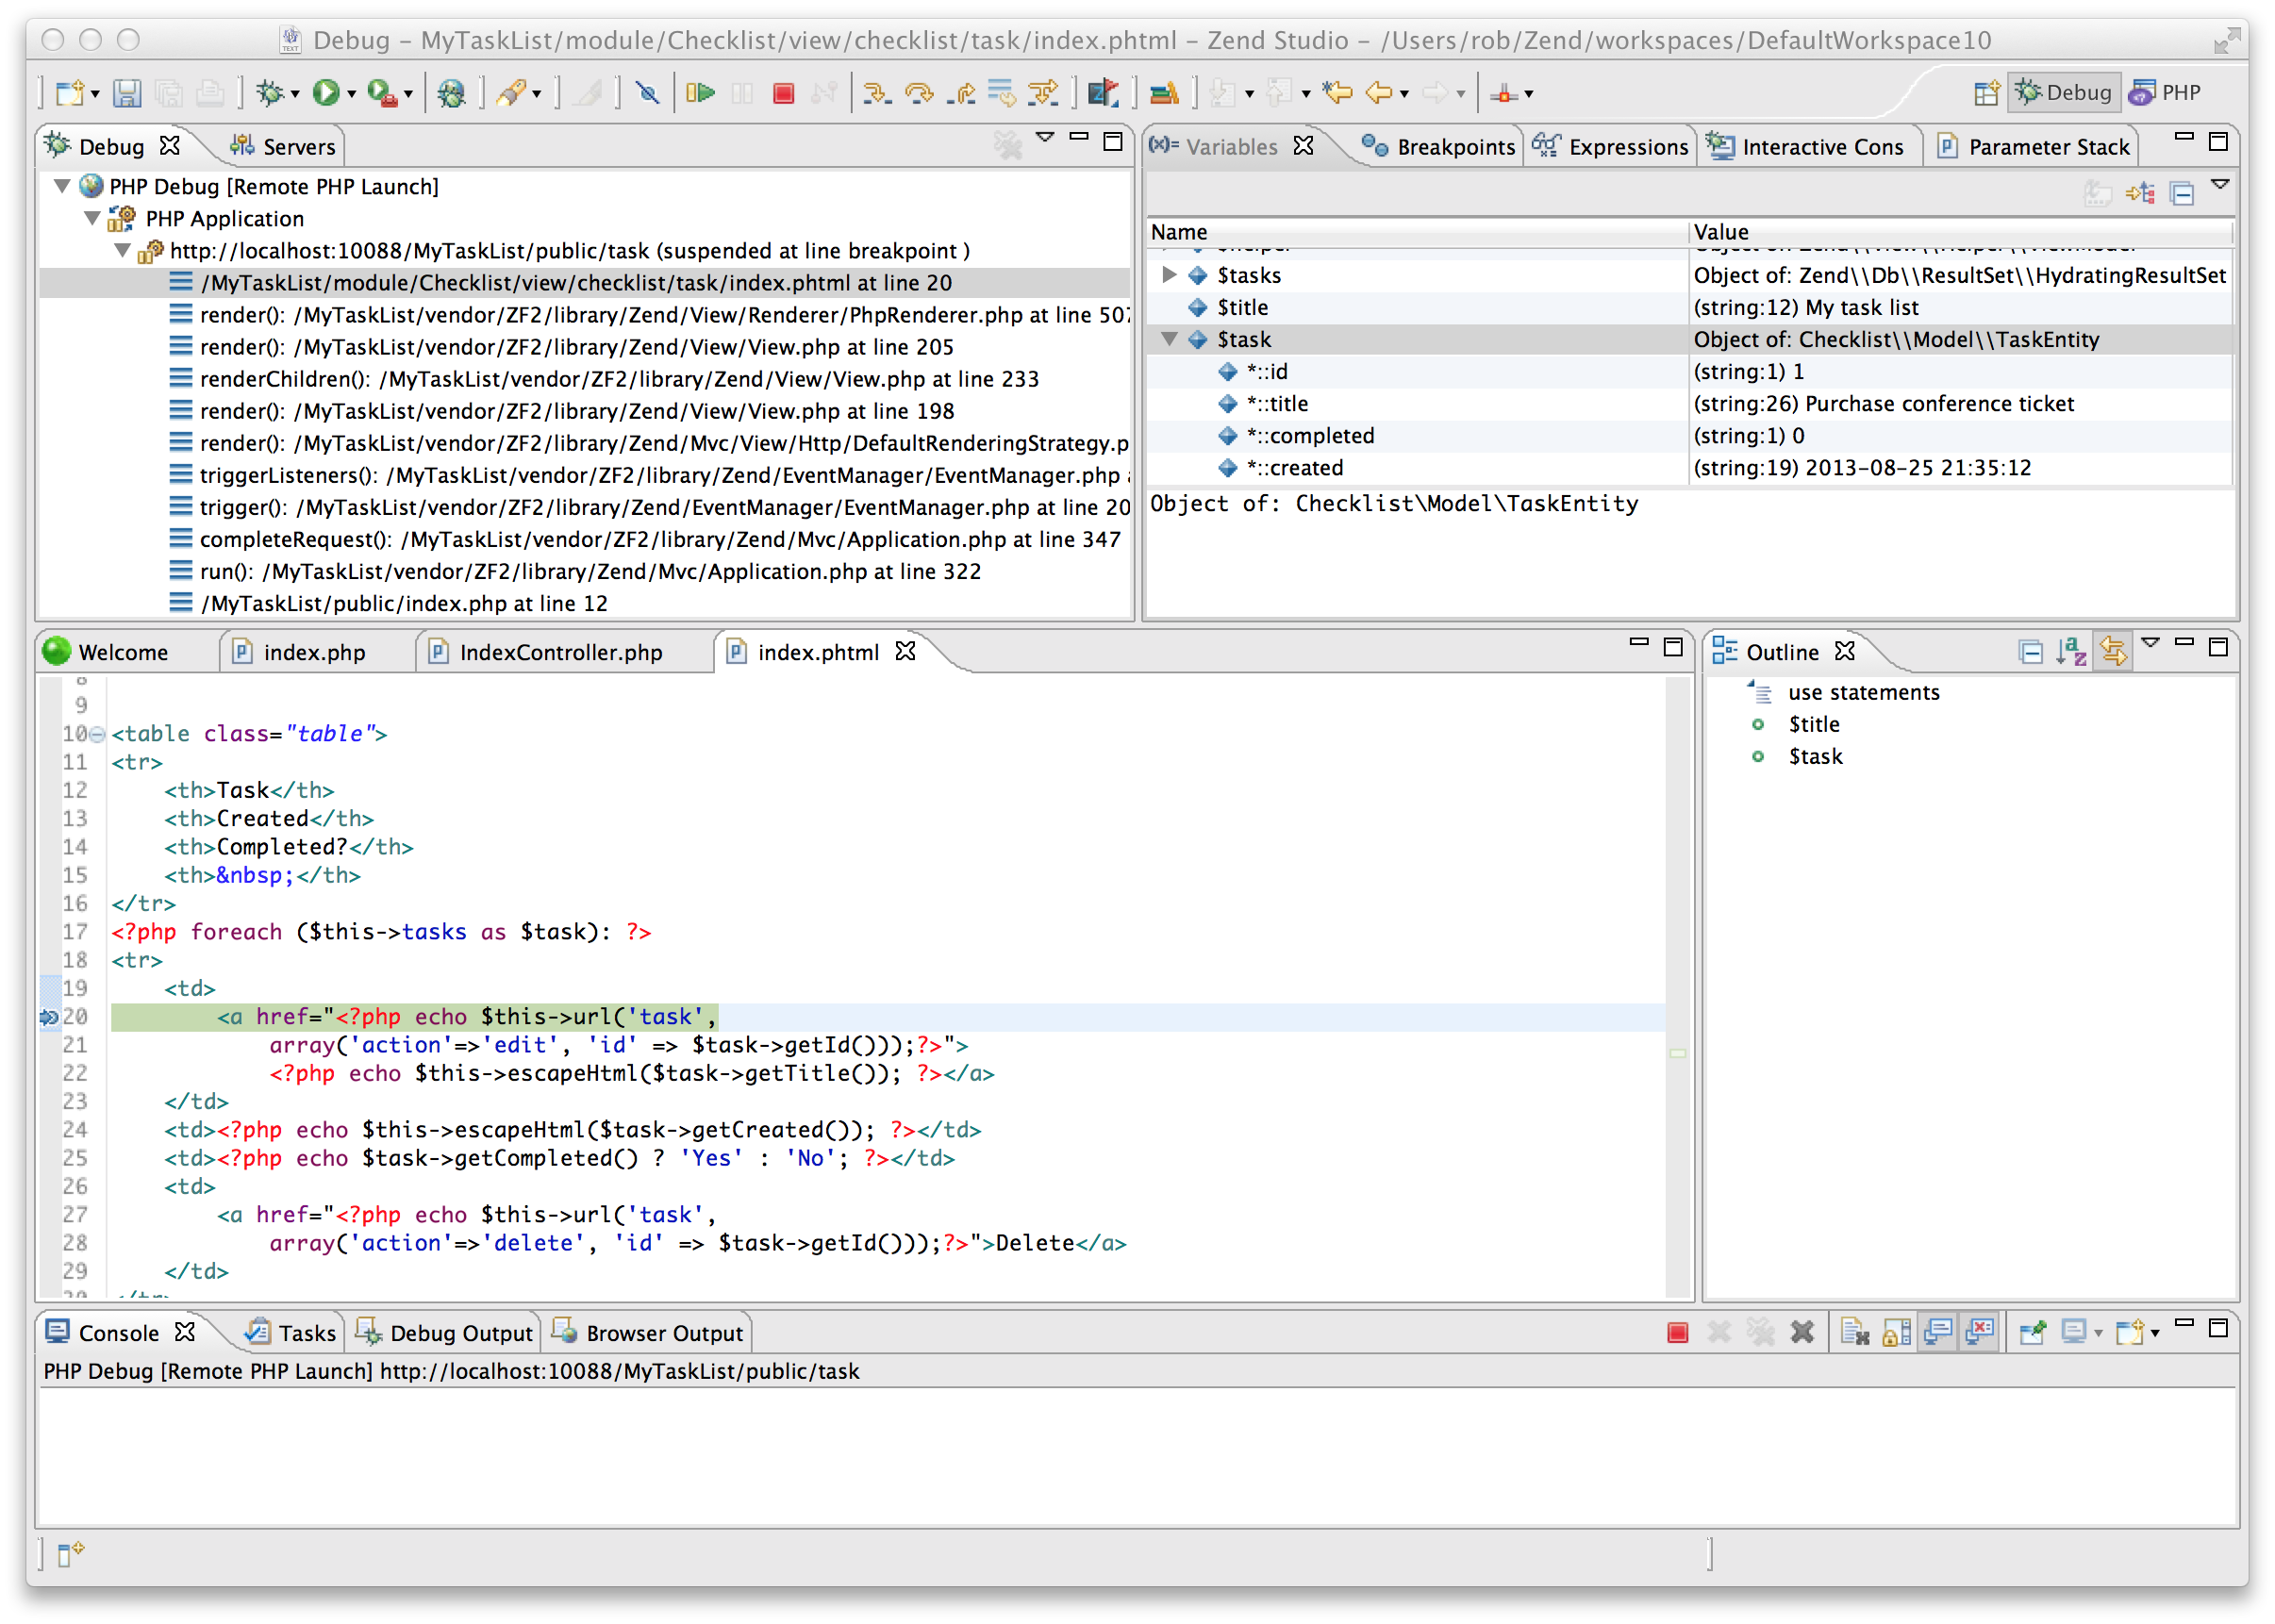
You will now see the code we are interested in. The centre pane shows our code
with the line that the debugger is stopped on highlighted. The top left pane
shows the stack trace which tells us which methods were used to get to this line
of code. The top right pane shows a list of variables in scope. You can click
the arrow next to $task to expand it and see the properties of the object.
Pressing F8 will resume running the application until the next breakpoint. As
our breakpoint is in a loop, it iterates once around the loop and stops again.
The data in $task is now the second database record. Once you have finished
inspecting the state of your code, you can press the square red stop button to
stop the debugging mode. Clicking the PHP button in the top right hand corner of
Zend Studio takes you back to the code editing view.
